Hands-On Lab: Grouping & Ungrouping Data in Excel
⏳ Training Time: 20–30 Minutes
🎯 Level: Beginner – Intermediate
🧠 Method: Hands-on Practice
📦 Material Format: Interactive, can be used offline
📌 Requirements: Able to create and sort tables in Excel
🎯 Goal: Participants understand how to group and ungroup data in Excel to make analysis easier.
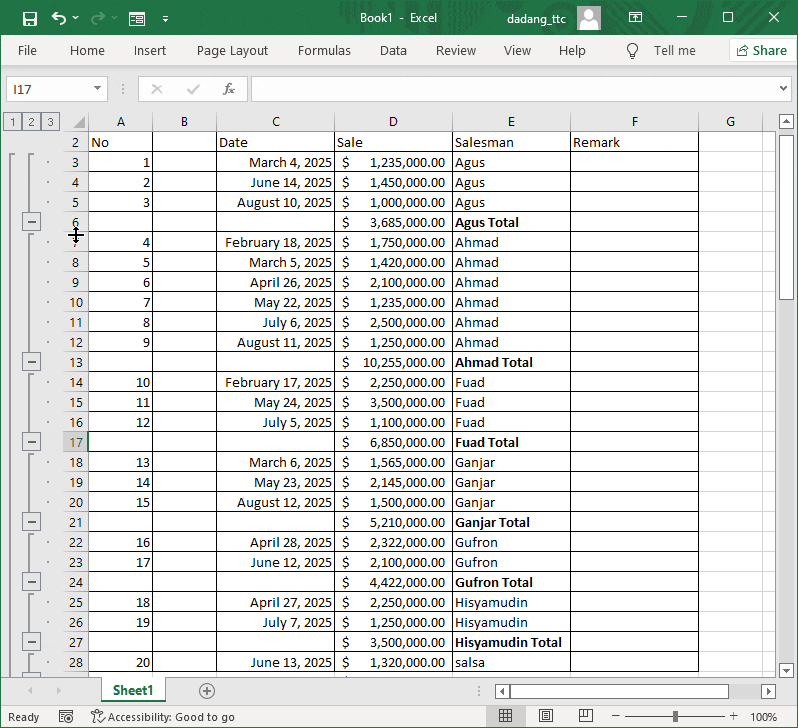
The Grouping feature in Excel is useful for hiding or showing specific parts of your data, often in long reports or tables. With grouping, you can create a cleaner view and focus only on the important data.
📦 Case Study – Summarizing Monthly Sales Data
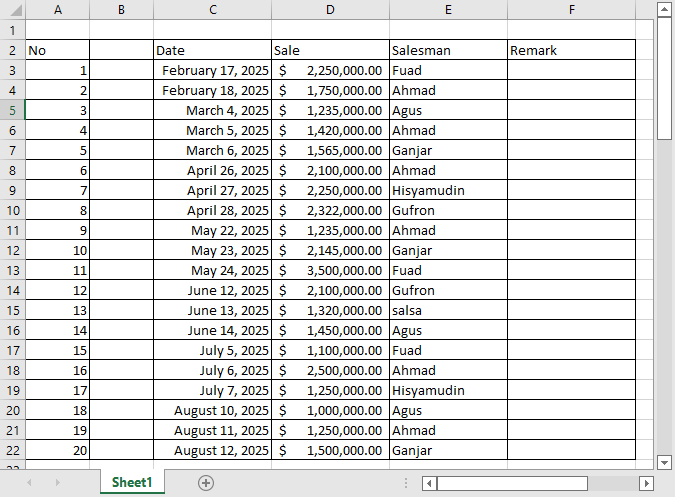
For example, you have daily sales data for an entire year. With grouping, you can organize the data by month so the report becomes cleaner and easier to read.
✨ Steps to Group Data
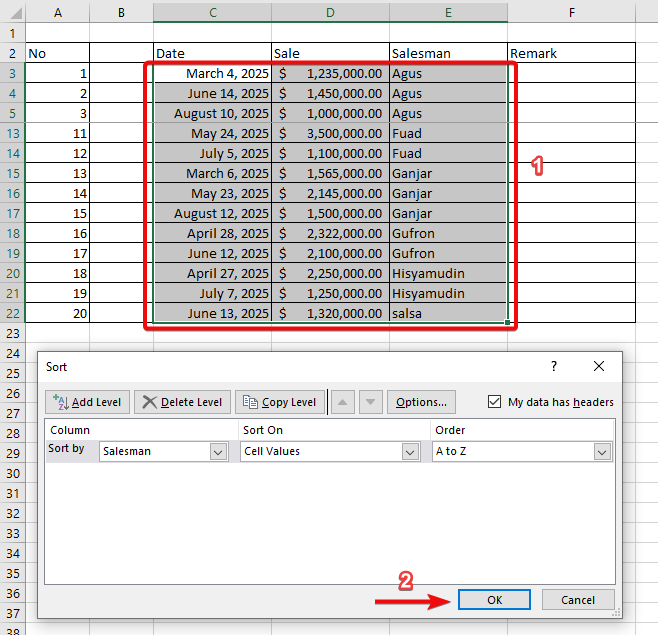
- Select the rows or columns you want to group.
- Go to Data → Group in the menu.
- Choose whether to group by Rows or Columns.
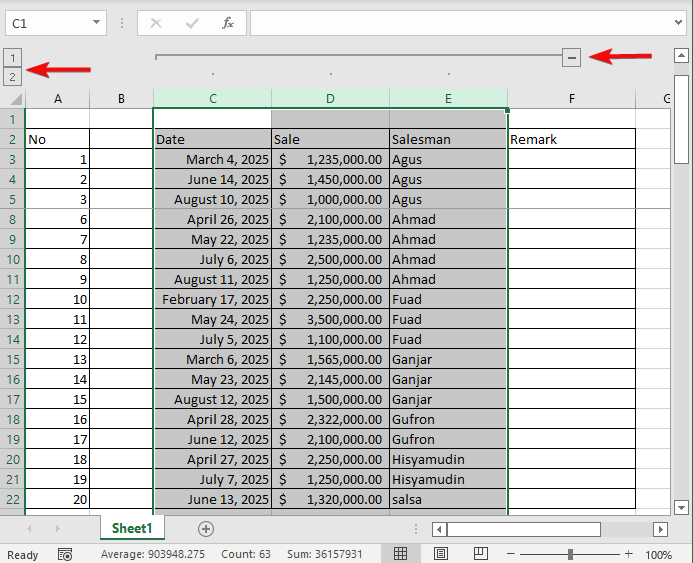
- Use the + / - buttons on the left/top side of the table to expand or collapse the data.
🔄 Steps to Ungroup Data
- Select the rows or columns that have been grouped.
- Go to Data → Ungroup.
- Choose Rows or Columns according to the previous grouping.
💡 Additional Tips
- Use grouping to make annual or monthly reports more concise.
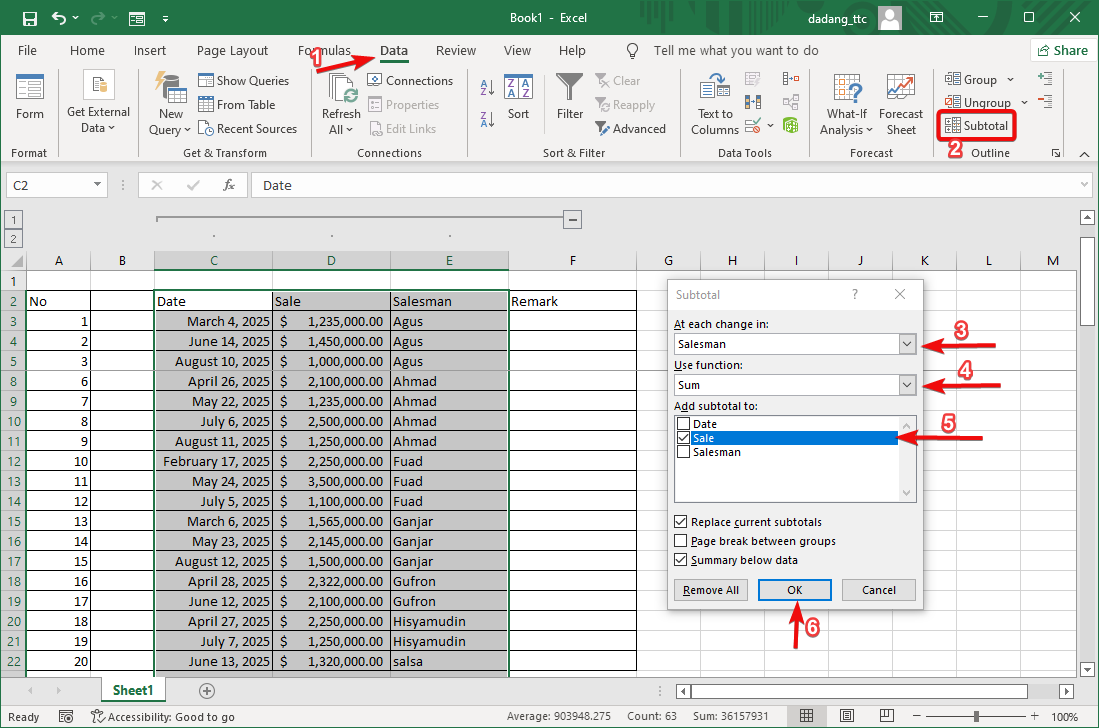
- Can be combined with Subtotal to automatically summarize data.
- Grouping does not delete data, it only changes the view.
📝 Exercise:
- Open your daily sales data or student attendance data.
- Group the data by month using the Group feature.
- Try expanding and collapsing the grouping to see the effect.
Want to Learn Excel and Computer Skills for Free?
Visit our complete guide and join TTC’s free classes: